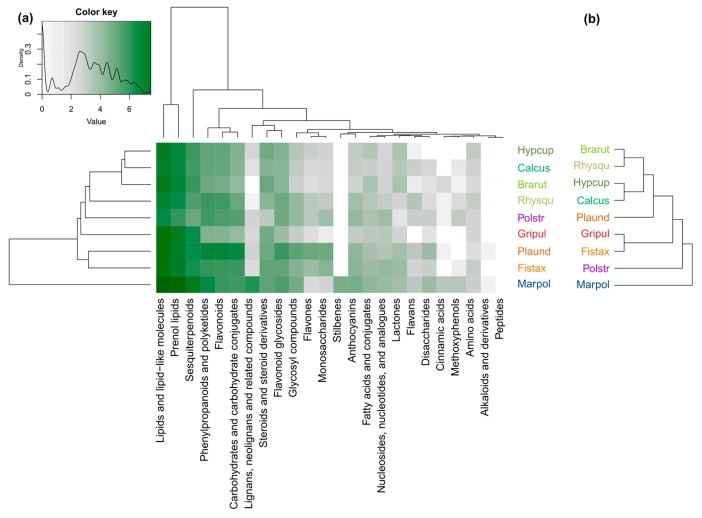
Figure 2.
Richness of chemical entities in the different compound classes of the bryophyte species, and chemotaxonomic vs. phylogenetic tree. (a) The heatmap shows the richness of compound classes in the bryophyte species. The intensity of the green color corresponds to the number of chemical entities. The color key represents the legend of the heatmap plot and shows the density distribution of counts throughout the range of values which is represented by white (zero counts) and green (counts per species) colors at a logarithmic scale. (b) Phylogenetic tree showing the phylogenetic relationships of the bryophyte species. Comparison metrics of the chemotaxonomic tree and the phylogenetic tree: Cophenetic correlation = 0.165; Mantel statistic = 0.16; Robinson–Foulds metric = 0.875.

