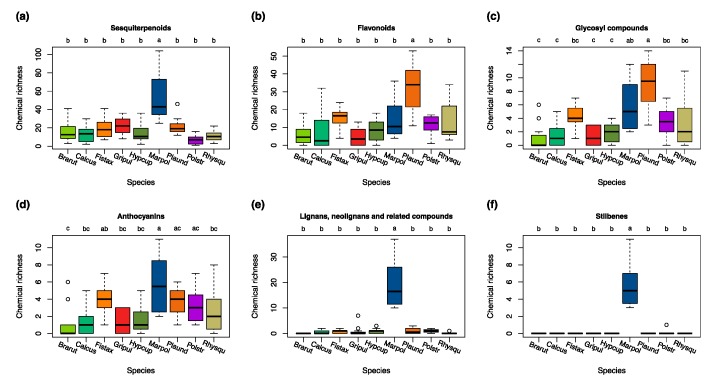
Figure 3.
Richness of chemical entities of the different bryophyte species within the chosen chemical classes of (a) sesquiterpenoids; (b) flavonoids; (c) glycosyl compounds; (d) anthocyanins; (e) lignans; neolignans, and related compounds; and (f) stilbenes. Differences among groups (letters on the top of the plot) are based on the Tukey HSD post hoc test on a one-way ANOVA. Different letters show significant differences (p < 0.05). n = 12 for each species. Red colors represent acrocarpous mosses. Green colors represent pleurocarpous mosses. A blue color represents liverworts.

