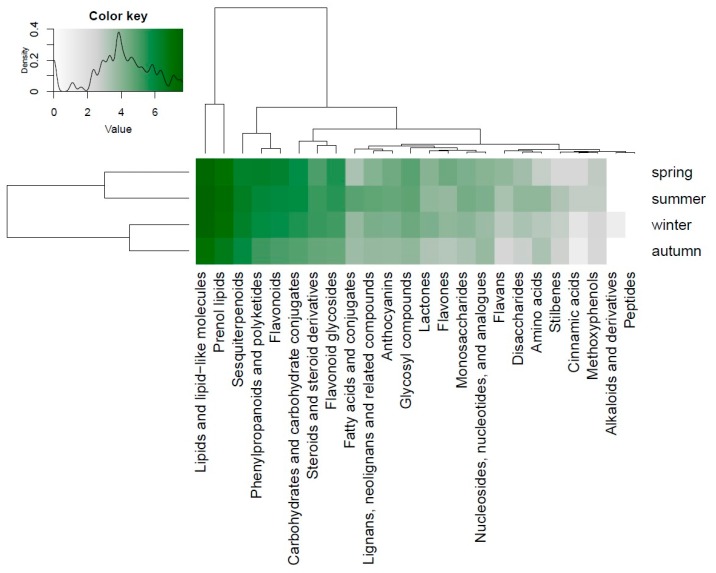
Figure 4.
The heatmap shows the richness in the compound classes and the relationship to the study factor seasons. The intensity of the green color corresponds to the number of chemical entities. The color key represents the legend of the heatmap plot and shows the density distribution of counts throughout the range of values which is represented by white (no counts) and green (many counts) colors at a logarithmic scale.

