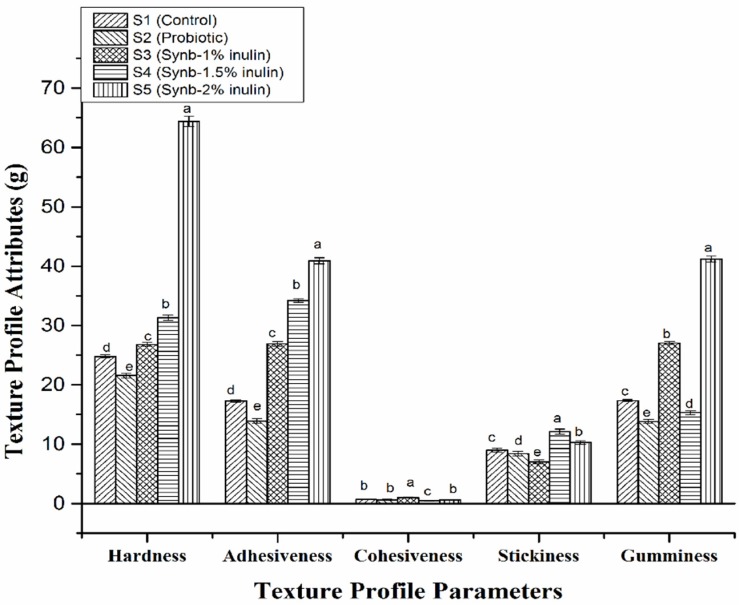
Figure 2.
Texture profile analysis of the control plain yogurt (S1), probiotic yogurt with 0.5% S. boulardii (S2), synbiotic yogurt with 0.5% S. boulardii + 1% inulin (S3), 0.5% S. boulardii + 1.5% inulin (S4), and 0.5% S. boulardii + 2% inulin (S5). Different letters denote statistical differences (p < 0.05).

