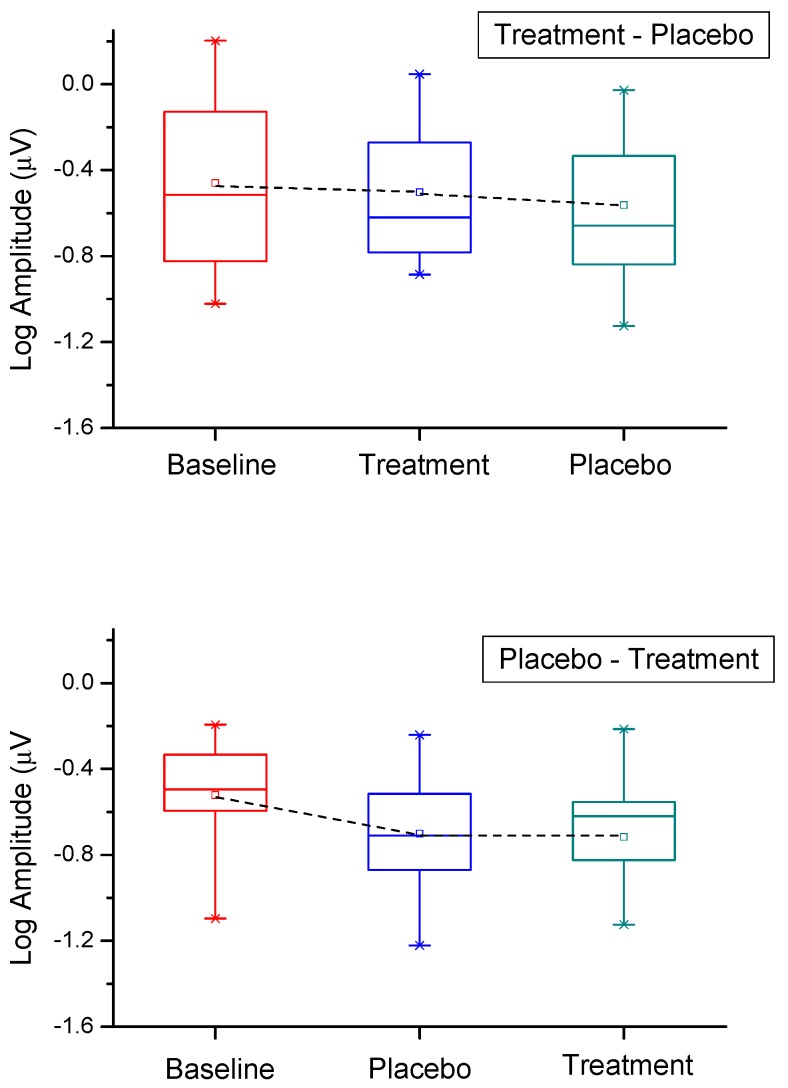
Figure 1.
Box plots the fERG amplitude values recorded at baseline and after six months of S (Treatment) or P (Placebo) supplementation, following the cross-over study design. The symbol and line in the middle of the box indicate the mean and the median, the box lower and upper boundaries the 25th and 75th percentiles, and the lower and upper whiskers the 5th and 95th percentiles, respectively.

