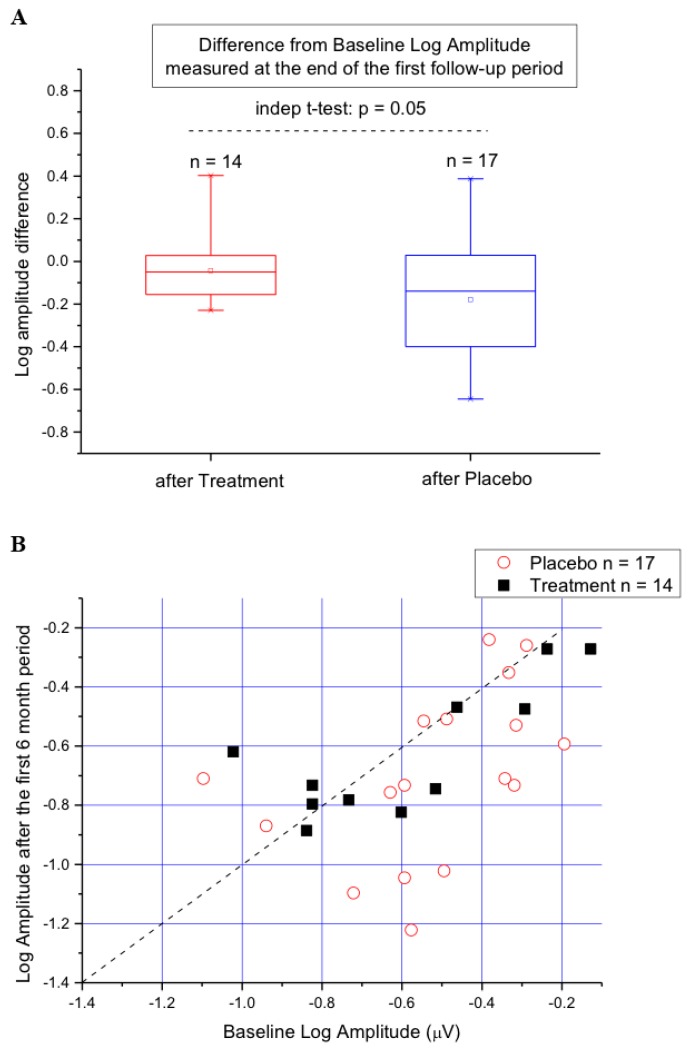
Figure 2.
(A) Box plot showing the difference from baseline fERG Log amplitude recorded at the end of the first six-month study period in patients assuming S (Treatment) and those assuming P (Placebo). (B.) The same changes recorded in A shown as a scatter of data points. The diagonal line in the plot indicates equivalence. It can be noted that in seven out of 17 patients assuming P, fERG amplitude losses were substantially larger compared to those recorded in the 14 patients assuming S.

