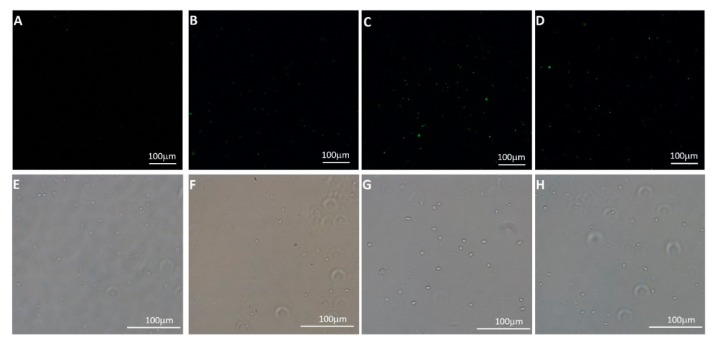
Figure 5.
Micrographs of FITC-NPLyo labeled WBC after different incubation periods: control (A,E), 15 min (B,F), 30 min (C,D), 45 min (D,H). Fluorescence images 20× magnification (A–D), and photo-micrograph of the sampled region, acquired using a brightfield camera with a 20× magnification (E–H). Scale bars correspond to 100 μm.

