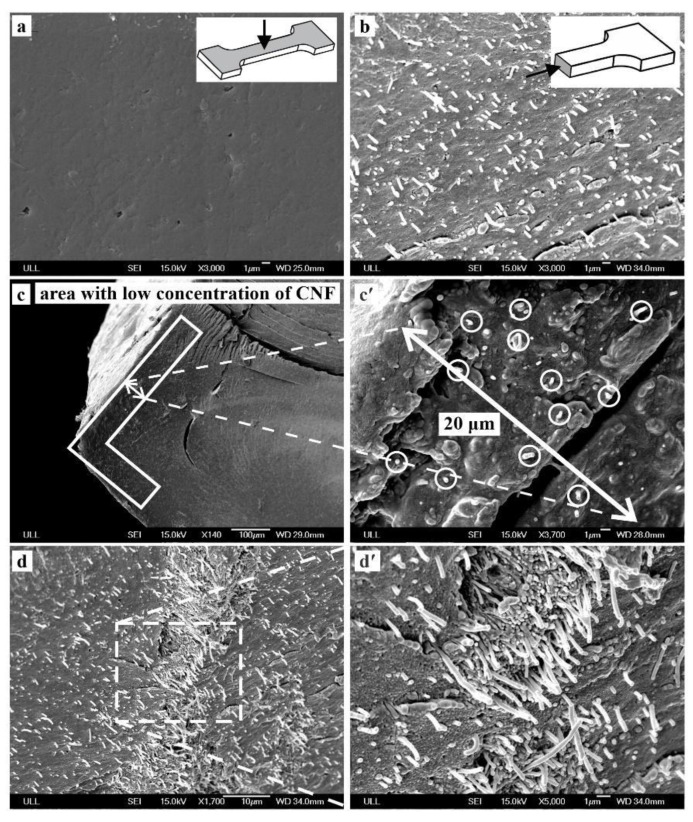
Figure 2.
SEM micrographs of the (a) surface of the polished sample that shows no traces of CNF, (b) dispersion of CNFs on brittle fractured cross section, (c) very first microns of the surface from cross-sectional view which shows very few numbers of CNFs, (d) high agglomeration of CNFs in core part of the brittle fractured sample. All images are taken from a 3 wt. % CNF/LDPE sample and images (c′) and (d′) are magnified versions of a section of images c and d, respectively.

