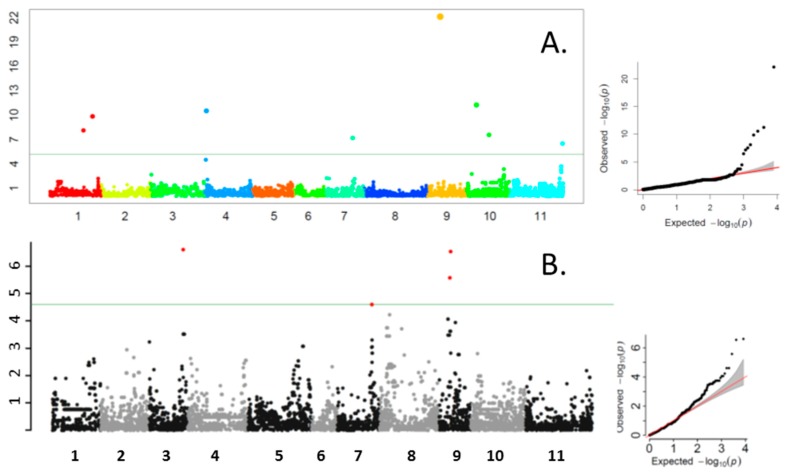
Figure 1.
Manhattan and quantile-quantile (QQ) probability plots for total phenolic content of pods from the Bean CAP snap bean diversity panel showing the location of SNPs significantly associated with total phenolic content quantitative trait nucleotides. X axis: chromosome number; Y axis: -log10 (P). Output from FarmCPU (A) and GAPIT (B), with a horizontal line representing the Bonferroni cut-off (α = 0.05).

