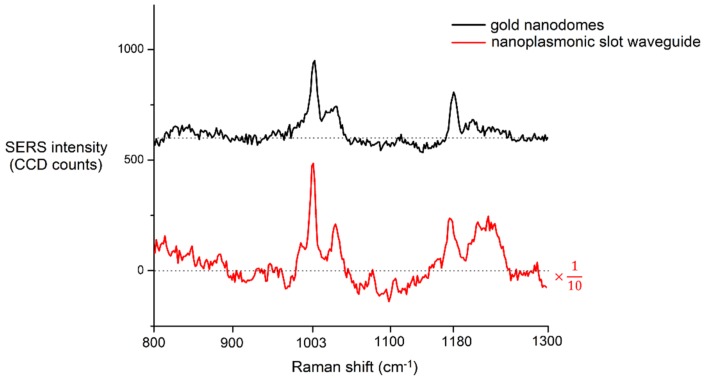
Figure 8.
Background-subtracted SERS spectra of the peptide NH2-CALNNFCNSFCNGGGGVR-GNFSF-COOH acquired on gold nanodomes and on the nanoplasmonic slot waveguide. The spectrum on the gold nanodomes was obtained using a laser power of 1 mW and an integration time of 1 s. The spectrum on the nanoplasmonic slot waveguide was obtained using a laser power of 1 mW and an integration time of 30 s, and the SERS intensity was divided by a factor of 10 to allow for better visualization. The spectra are offset on the y-axis for clarity, and the dashed line represents the zero line of each spectrum.

