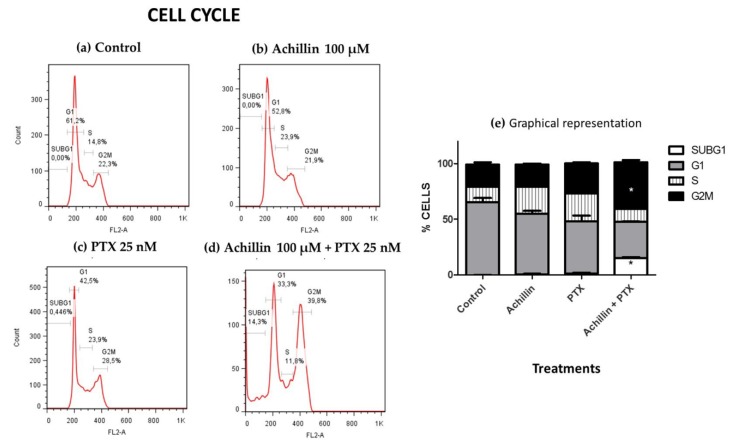
Figure 5.
Cell cycle disruption by PTX antitumor drugs and Achillin. Figure 5(a–d) shows the percentages of Hep3B/PTX cells in the G0/G1, S and G2/M cycle phases and of cells with sub-G1 DNA content after different treatments. (a) Cells without treatment (control). (b) Achillin 100 μM. (c) PTX 25 nM. (d) Achillin 100 μM + PTX 25 nM. (e) Graphical representation of histograms and cell frequencies representative of three determinations. Achillin was applied 2 h before PTX. * p ≤ 0.05.

