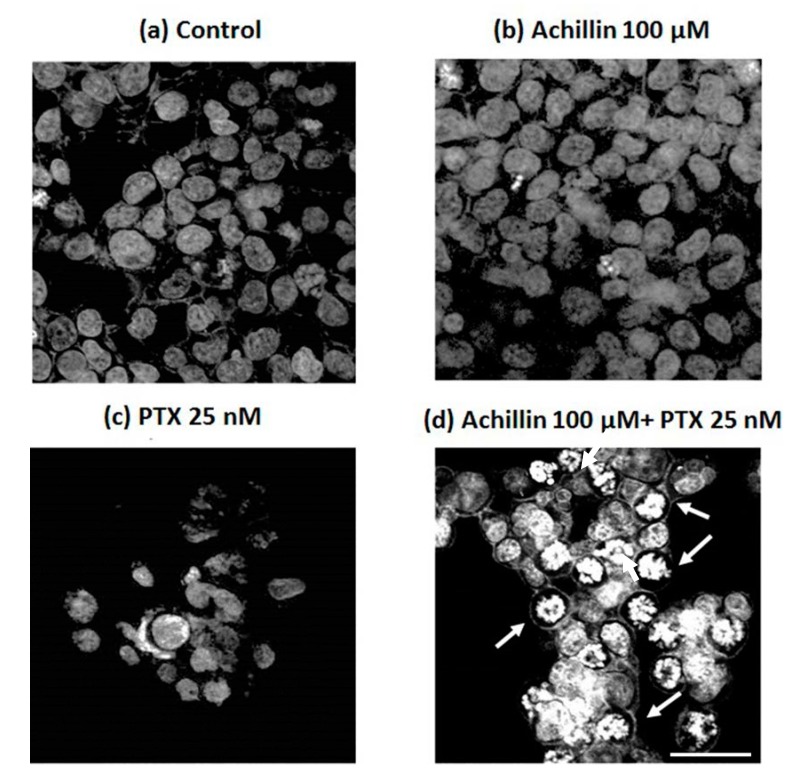
Figure 6.
Confocal microscopy of DAPI-stained treated Hep3B/PTX cells. (a) Negative control, without treatment cells. (b) Achillin 100 μM. (c) PTX 25 nM. (d) PTX 25 nM + Achillin 100 μM. Images are representative of the three independent experiments. Images were acquired at 40X objective plus a 2X zoom in confocal microscope settings. Scale bars, 40 μm.

