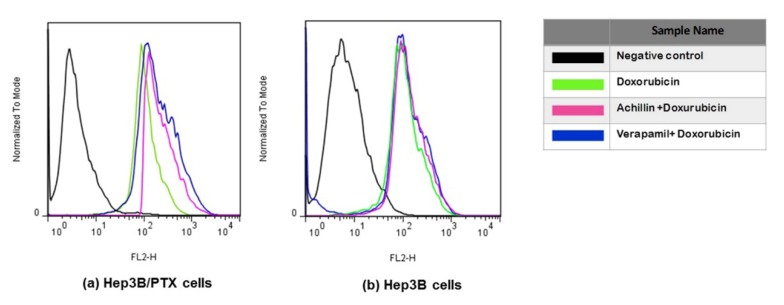
Figure 10.
Doxorubicin accumulation. Flow cytometry overlay of Doxorubicin fluorescence intensity after treatments: (a) Hep3B/PTX, (b) Hep3B cells, and Hep3B/PTX cells. The cells treated with DMSO were used as the negative control (black line); Doxorubicin 20 μM (green line), pretreatment 100 μM Achillin plus Doxorubicin 20 μM (pink line), and pretreatment 20 μM Verapamil plus Doxorubicin 20 μM (blue line) in Hep3B cells.

