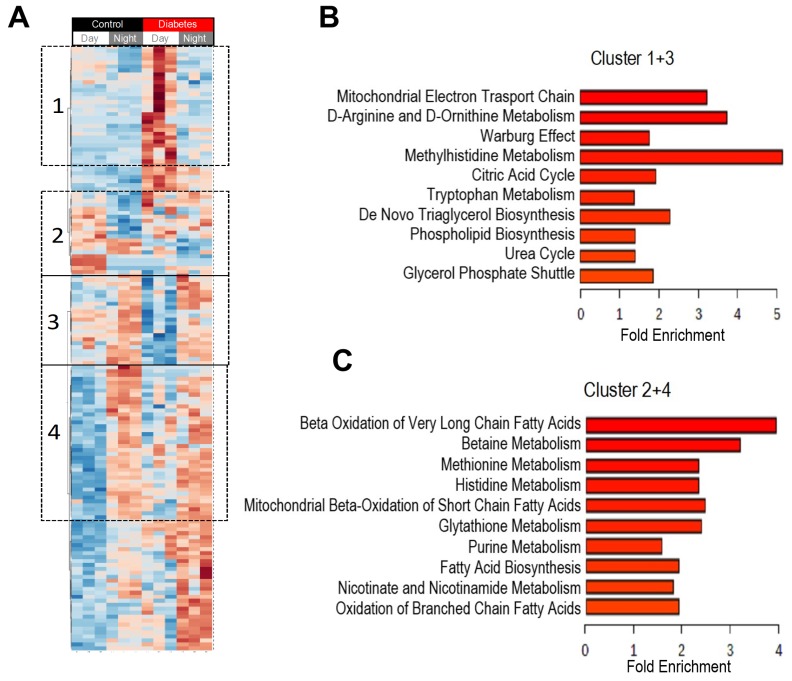
Figure 3.
Heatmap of plasma metabolites that changed during the transition from day to night. Blood samples were collected at day time (ZT5) and at night time (ZT17) from 10-month-old db/db (diabetic) and aged-matched db/m (control) mice. Untargeted global metabolomics analysis was performed with the Metabolon Platform (Metabolon Inc). MetaboAnalyst was used for the analysis. (A) Heatmap of statistically significant metabolites. We identified clusters that gained diurnal rhythmic patterns (increased (Cluster 1) or decreased (Cluster 3) in diabetes in the day but did not change in controls and clusters that lost diurnal rhythmic patterns in diabetes (increased (Cluster 2) or decreased (Cluster 4) in control in the day but did not change in diabetes. (B) Enrichment analysis of metabolites that gained rhythmic patterns in diabetes (Cluster 1 and 3). (C) Enrichment analysis of metabolites that lost rhythmic patterns in diabetes (Cluster 2 and 4). n = 3 per time point per group.

