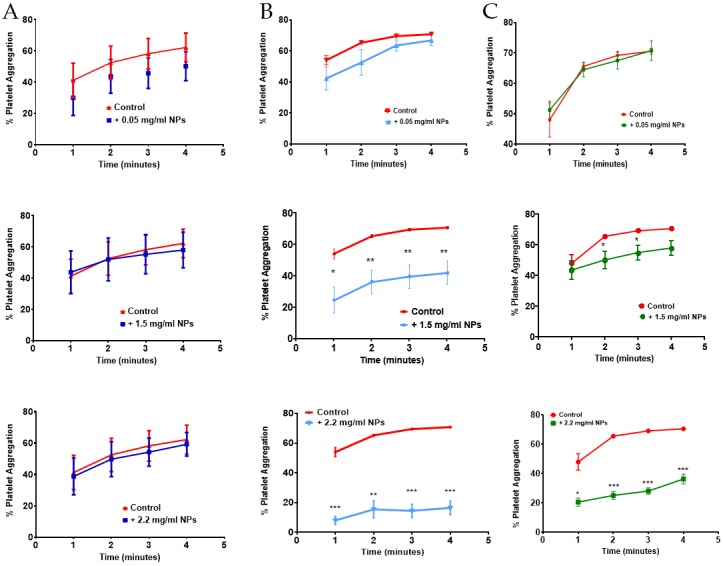
Figure 2.

Effect of PLGA-PEG NPs of (A) 112 nm, (B) 348 nm, and (C) 576 nm at 0.05, 1.5, and 2.2 mg/mL on platelet aggregation profile for 4 min following the addition of thrombin. Data are the average of n = 4–6 experiments ± SEM. * p < 0.05, ** p < 0.01, *** p < 0.001 compared with 0.1 U/mL thrombin (control), one-way ANOVA, and unpaired student t-test, at each time point.
