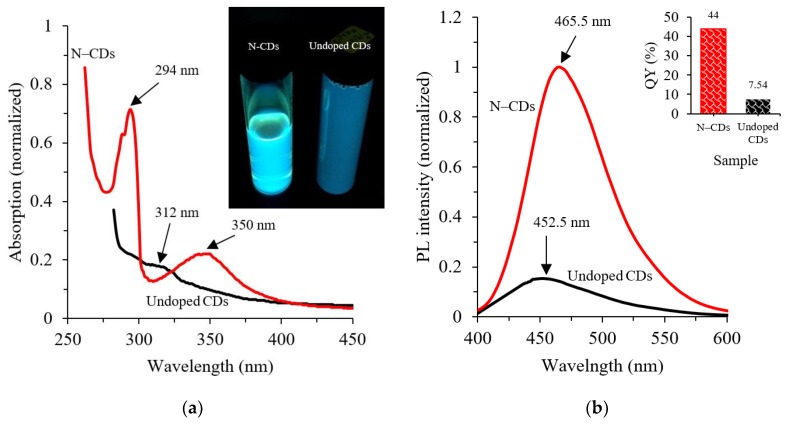
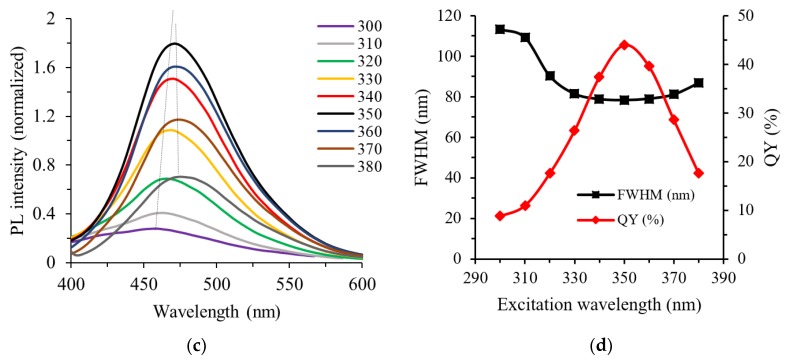
Figure 3.
(a) Absorption spectra of undoped and N–CDs, (b) fluorescence PL spectra of undoped and N–CDs excited at 350 nm, with A350 = 0.04, (c) PL spectra of N–CDs under various excitation wavelengths (300–380 nm) and (d) emission full width at half maximum (FWHM) and quantum yield (QY) as a function of excitation wavelength. The inset in panels (a) for the corresponding photographs under 365 nm UV light and (b) the corresponding calculated QYs.


