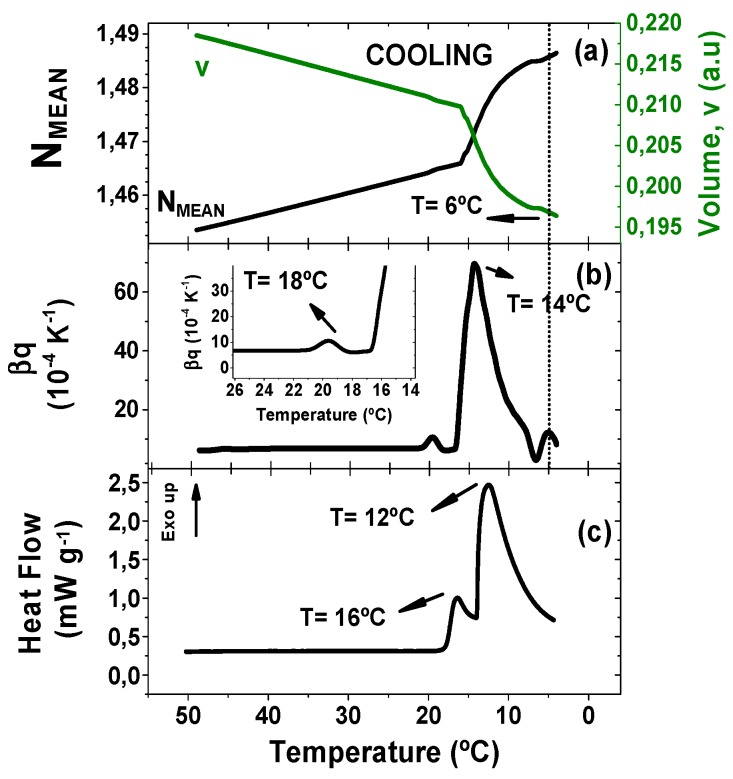
Figure 1.
Comparison of the temperature dependence during cooling at 0.5 K min−1 of (a) NMEAN and Volume (a.u.) recorded via TMOR with temperature modulation of 0.5 K amplitude and 17 mHz modulation frequency. (b) The thermal volume expansion coefficient βq (K−1) recorded via TMOR with temperature modulation of 0.5 K amplitude and 17 mHz modulation frequency, and (c) heat Flow (mW g−1) recorded via DSC.

