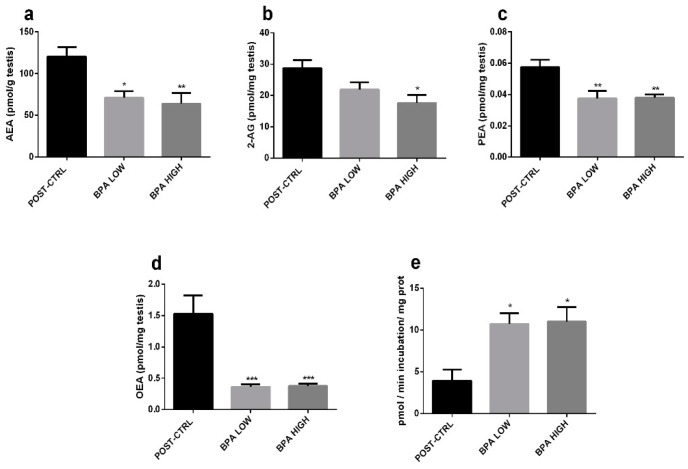
Figure 4.
(a–d) Testicular Endocannabinoid levels. Data reported as mean ± SEM. Asterisks above each column denote significant differences between POST-CTRL and BPA groups (one-way ANOVA, Dunnett’s multiple comparisons test, * (p < 0.05), ** (p < 0.01), *** (p < 0.001)). AEA expressed as pmol/gr tissue, while 2-AG, PEA and OEA as pmol/mg tissue. (e) FAAH enzymatic activity in testes. Data reported as mean ± SEM of pmol/minutes incubation/mg protein. Asterisks above each column indicate significant differences between POST-CTRL and BPA group (one-way ANOVA, Dunnett’s multiple comparisons test, * (p < 0.05)).

