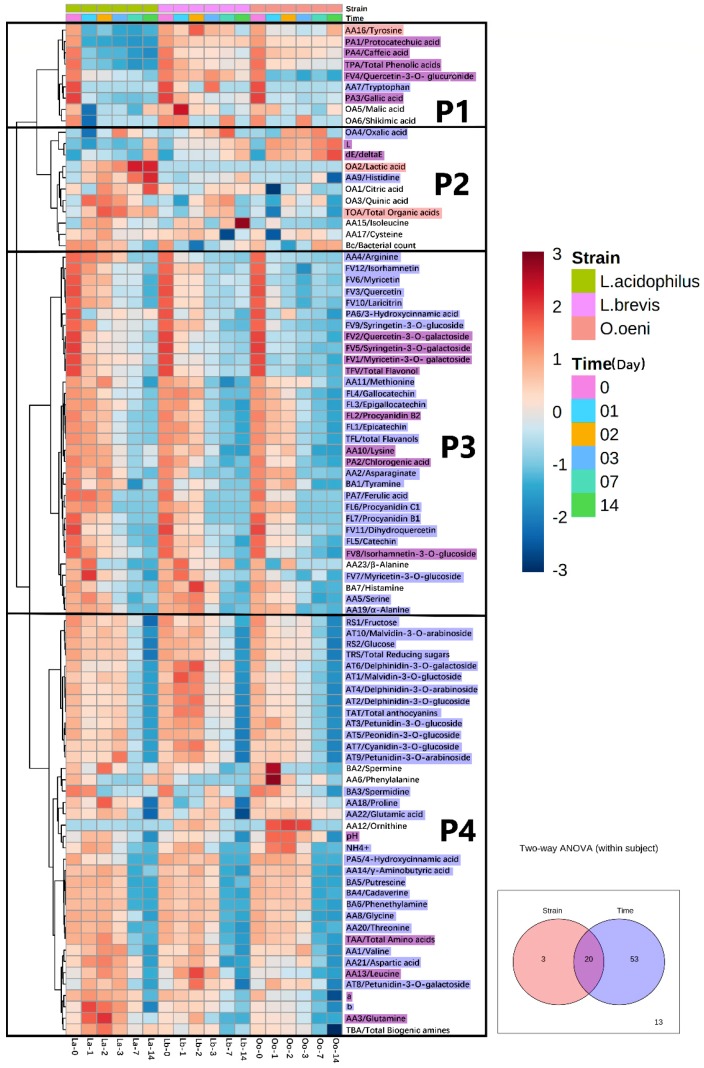
Figure 2.
Evolution of all the compounds in the inoculated bog bilberry juices 0–14 days and a two-way ANOVA analysis for both strain and time effects and their interactions. The compound names colored with “ ” and “
 ” shows the variables mainly affected by strain or time, respectively; the compounds colored with “
 ” show the variables affected by both strain difference and time (p < 0.05). Compounds without color are not affected by the main effects.

