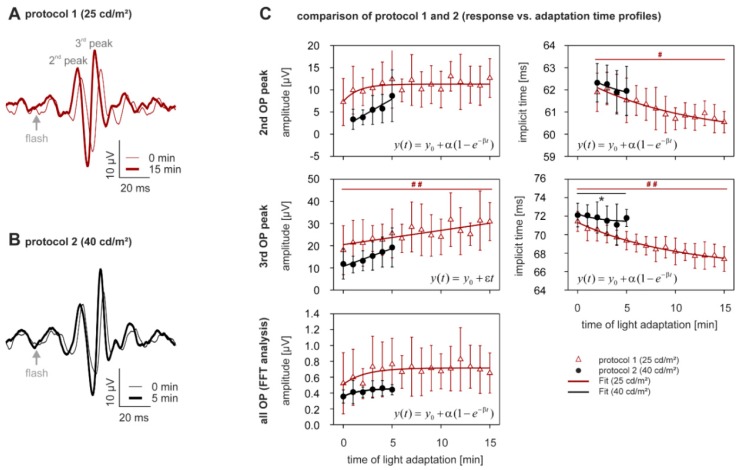
Figure 2.
Light adaptation—OP analysis. (A,B) for subject averaged OPs in the same format as Figure 4. Subject averaged (C) amplitudes for the second and third OP waves and for the general OP in the frequency domain vs. time of photopic adaptation (same format as in Figure 4). n25 cd/m2 = 10, n40 cd/m2 = 9.

