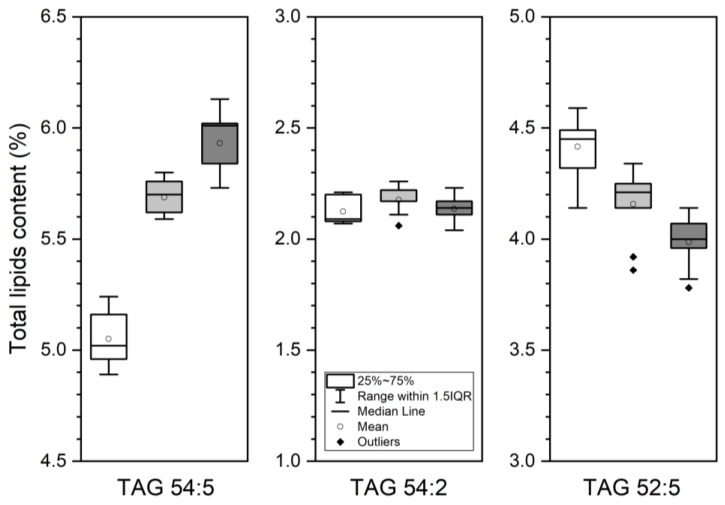
Figure 6.
Representative changes observed in TAG 54:5 (18:1/18:2/18:2), 54:2 (16:0/18:1/20:1), and 52:5 (16:0/18:2/18:3) when comparing Arabidopsis control (WT, white) and octanoyltransferase mutants (lip2p1, grey, and lip2p2, dark grey) mature seeds. Data are average values ± SD of three biological replicates with two technical ones.

