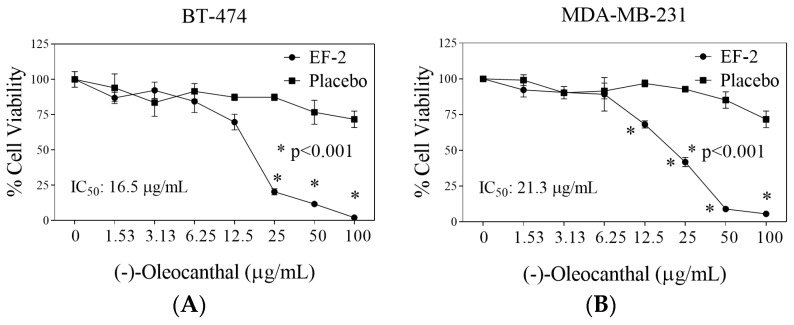
Figure 6.
Comparison of the in vitro effects of EF-2 and its placebo on the growth of ER+/HER2+ BC cells BT-474 and the TNBC MDA-MB-231 cells. (A) Effect of EF-2 and its placebo treatment on the growth of BT-474 cells after 48 h culture period. (B) Effect of EF-2 and its placebo treatment on the growth of MDA-MB-231 cells after the 48 h culture period. Cells were plated at a density of 1×10⁴ cells/well in 96-well plates and maintained in media supplemented with 10% FBS and allowed to adhere overnight. Cells were then treated with placebo or increasing EF-2 concentrations in serum-free media for 48 h. At the end of treatment, the viable cell number was determined by the MTT colorimetric assay. Vertical bars indicate mean cell count ± SD (n = 6) in each treatment group. *p < 0.05 as compared with vehicle-treated controls.

