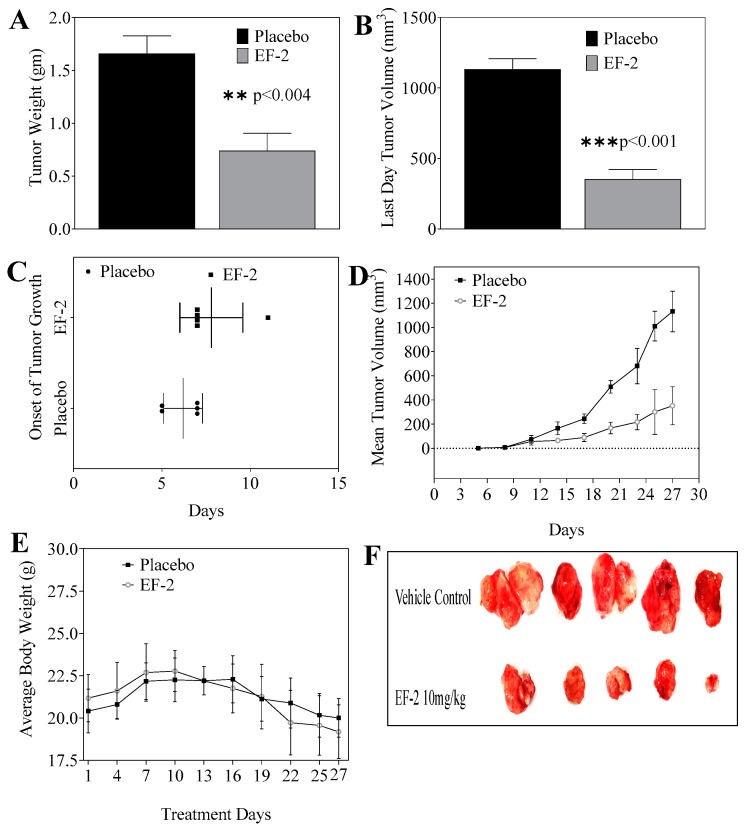
Figure 7.
Comparison of the in vivo effects of EF-2 and its placebo on the progression of BT-474 BC cells in the athymic nude mouse orthotopic xenograft model. (A) Vertical bars represent mean tumor weight at the end of the experiment. (B) Vertical bars represent mean tumor volume at the end of the experiment. (C) Comparison of the onset of tumor initiation in animals treated with EF-2 and its placebo. (D) Monitoring the tumor volume in different treatments over the experiment course. Points represent the mean tumor volume of several tumors (n = 5) in each experimental group during the treatment period. Error bars indicate SD for n = 5. (E) Monitoring mice body weight over the experiment course. (F) Excised primary tumors of each experimental group after the end of the tumor growth experiment. Top row: mice tumors obtained from the placebo-treated control group. Bottom row: tumors excised from mice treated with OC 10 mg/kg in EF-2 formulation.

