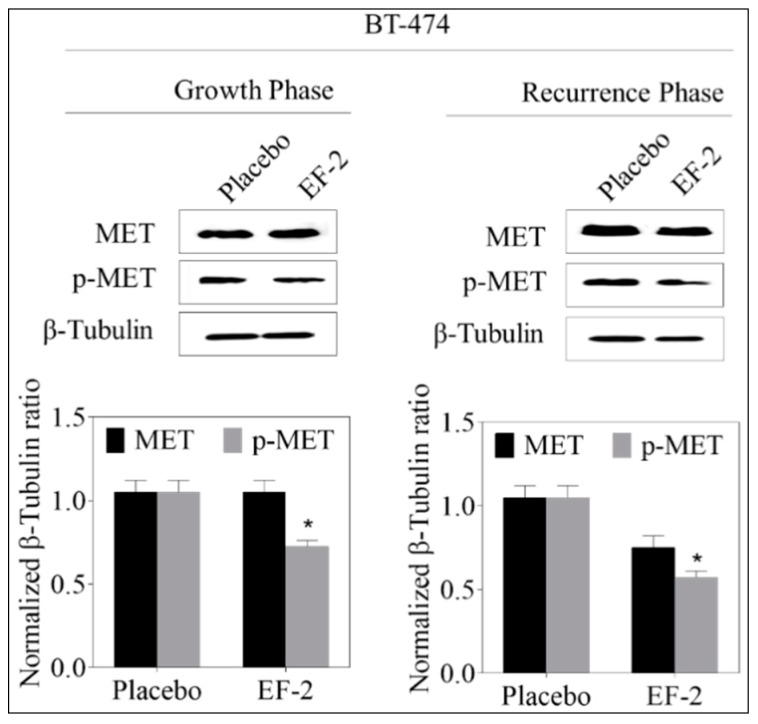
Figure 9.
Evaluation of the pharmacodynamic effects of EF-2 via assessing its suppressive effect on c-MET activation, the main OC validated molecular target in BT-474 cells in nude mouse xenograft models. Left panel: Western blot analysis of excised primary tumors. Right panel: western blot analysis of recurrence tumors. Bottom panels: Scanning densitometric analysis and the integrated optical density of each band was normalized with corresponding β-tubulin. Error bars indicate ± SEM for n = 5. *p < 0.05 as compared to vehicle-treated controls.

