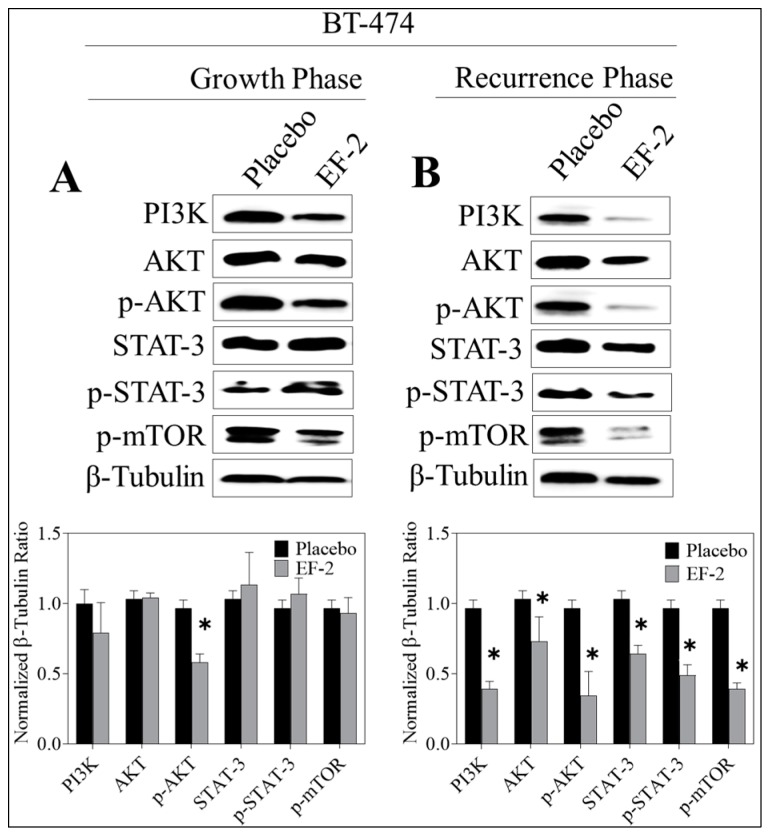
Figure 10.
Comparison of the c-MET downstream signaling proteins in BT-474 tumor cell lysates of primary excised tumors (early treatment phase) and recurrence tumors (recurrence phase) in response to treatment with EF-2 and its placebo control in nude mouse xenograft models. (A) Upper left panel: Western blot analysis of excised primary tumors. Lower left panel: densitometric quantification of the Western blotting bands. (B) Upper right panel: Western blotting analysis of recurrence tumor downstream markers. Lower right panel: densitometric quantification of the Western blot bands. Scanning densitometric analysis and the integrated optical density of each band was normalized with corresponding β-tubulin. Error bars indicate ± SEM for n = 5. *p < 0.05 as compared with vehicle-treated controls.

