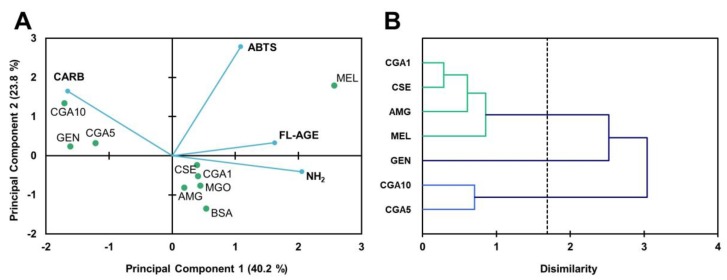
Figure 6.
Biplot (scores of samples and load factors of each variable) of the principal component analysis (PCA) (A), including the content of free amino groups (NH2), fructosamine (FRUCT), fluorescent AGE (FL-AGE), total AGE (T-AGE), and protein carbonyls (CARB) (A), and a dendrogram of the hierarchical cluster analysis of the glycation inhibitory activity (B) of the samples of the BSA-MGO glycation system (72 h incubation, 37 °C, pH 7.4) BSA: negative control; MGO: BSA + methylglyoxal; AMG: BSA + methylglyoxal + aminoguanidine; CSE: BSA + methylglyoxal + CSE (12,5 mg mL−1); CGA1: BSA + methylglyoxal + 1 mmol L−1 CGA; CGA5: BSA + methylglyoxal + 5 mmol L−1 CGA; CGA10: BSA + methylglyoxal + 10 mmol L−1 CGA; GEN: BSA + methylglyoxal + 5 mmol L−1 genistein; MEL: BSA + methylglyoxal + 5 mmol L−1 melatonin.

