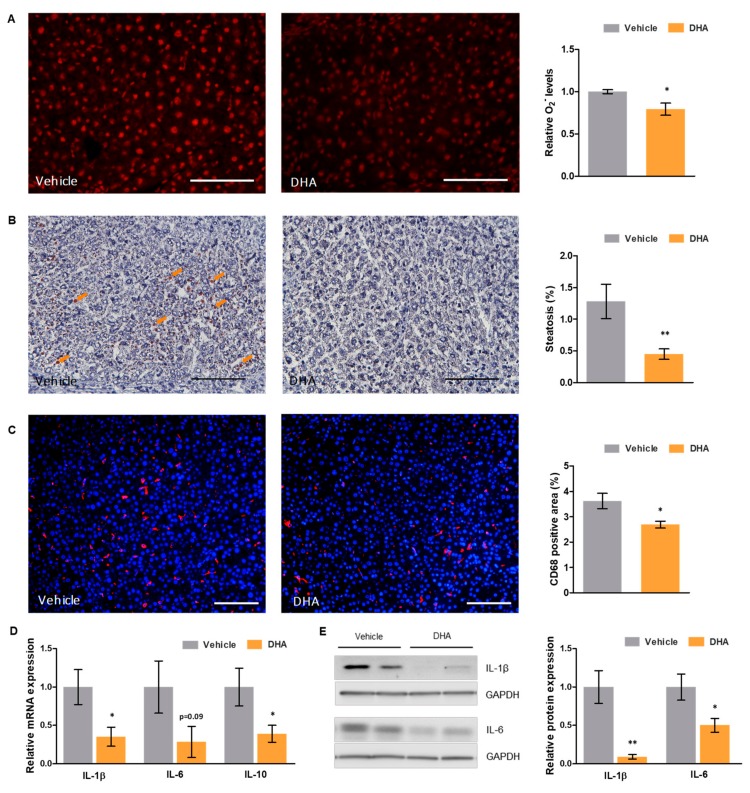
Figure 1.
Effects of DHA on oxidative stress and inflammation in a rat model of ACLD. (A) Representative images of dihydroethidium staining in liver tissue sections from cirrhotic rats treated with DHA or vehicle (left—scale bar represents 200 μm), and corresponding quantification of superoxide (O2−) levels (right). (B) Representative images of oil red O staining of liver tissue cryosections from cirrhotic rats treated with DHA or vehicle (left—scale bar represents 100 μm), and corresponding quantification (right). (C) Representative images of CD68 immunofluorescence in liver tissue sections from cirrhotic rats treated with DHA or vehicle (left—scale bar represents 200 μm; CD68 positive cells in red and nuclei in blue), and corresponding quantification (right). (D) Relative mRNA and (E) protein expression of key interleukins in total liver tissue from cirrhotic rats treated with DHA or vehicle, normalized to GAPDH. Results are expressed as mean ± S.E.M. * p < 0.05 and ** p < 0.01 vs. vehicle. n = 3 per group (A), n = 11 per group (B, C), and n = 10 per group (D,E).

