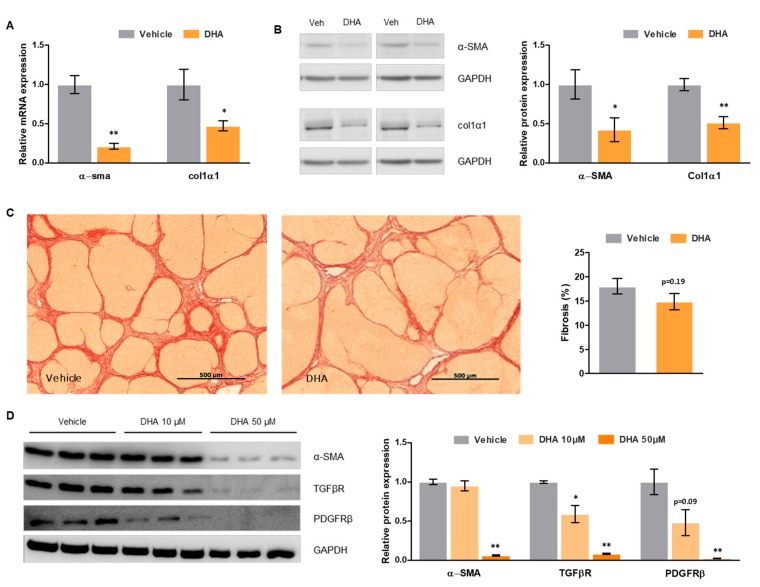
Figure 3.
Effects of DHA on hepatic stellate cell (HSC) phenotype and fibrosis. (A) α-SMA and collagen-1α1 relative mRNA expression in total liver tissue from cirrhotic rats treated with DHA or vehicle, normalized to GAPDH. (B) α-SMA and collagen-1α1 relative protein expression in total liver tissue from cirrhotic rats treated with DHA or vehicle, normalized to GAPDH. (C) Representative images of Sirius Red staining of liver tissue sections from cirrhotic rats treated with DHA or vehicle (left—scale bar represents 500 μm), and corresponding quantification (right). (D) α-SMA, TGFβR and PDGFβR relative protein expression in LX-2 HSCs treated with DHA (10 and 50 µM) or vehicle, normalized to GAPDH. Results are expressed as mean ± S.E.M. * p < 0.05 and ** p < 0.01 vs. vehicle. n = 10 per group (A–C), and n = 3 per group (D).

