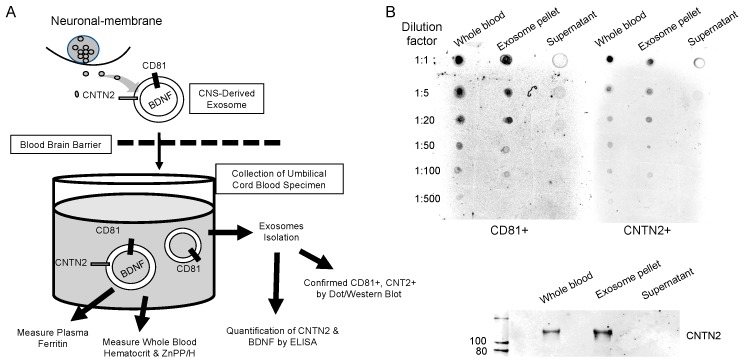
Figure 1.
Flowchart of experimental study and validation of exosomal isolation. (A) Flowchart depicting methodology in brief. (B) Dot blot depicting qualitative levels of CD81 and CNTN2 within whole blood, the exosome pellet, and the supernatant. Bottom panel shows a Western blot image depicting qualitative levels of CNTN2 within those same three groups.

