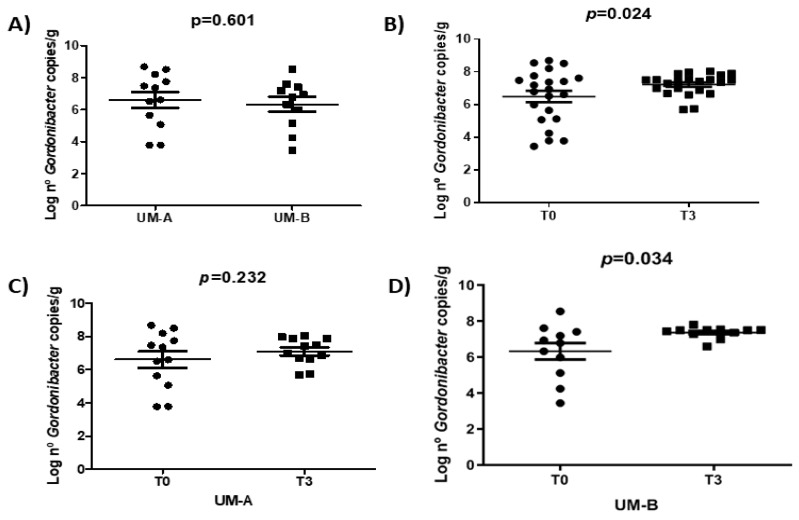
Figure 3.
Microbiota composition before (T0) and after the intervention (T3). Gordonibacter levels measured using qPCR according to UMs before the intervention (A). Gordonibacter levels before and after the intervention for all the participants (B). Gordonibacter levels before and after the intervention for UM-A (C) and UM-B participants (D). Paired t-test was used to test significance differences in Gordonibacter levels before and after the intervention. Results are presented as mean ± SEM.

