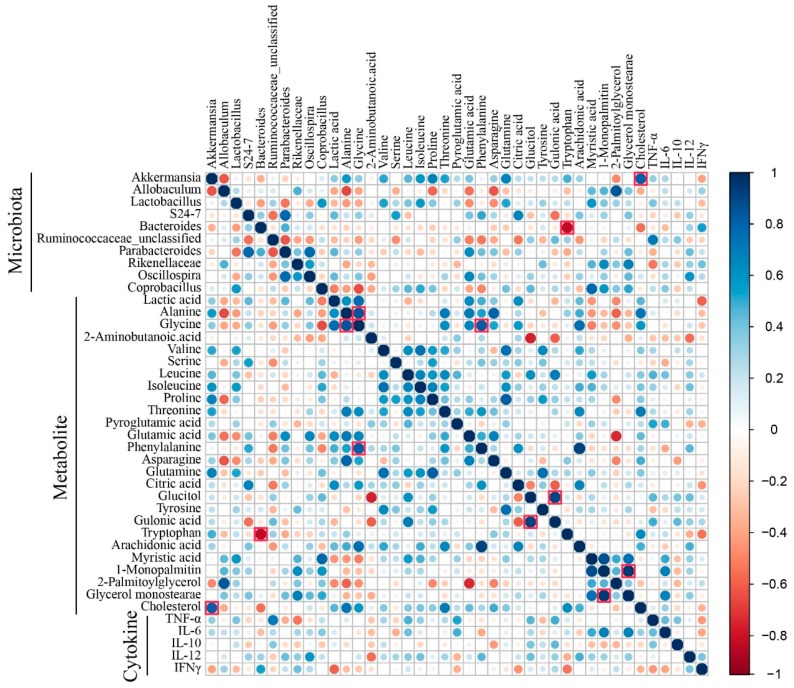
Figure 6.
Heat map derived from the correlations among the altered gut microbiota, disturbed metabolites in serum, and changed cytokine levels. The correlation matrixes were formed based on Spearman’s rank correlation coefficients. The correlation coefficients greater than 0.8 in the heat map were indicated by red square borders.

