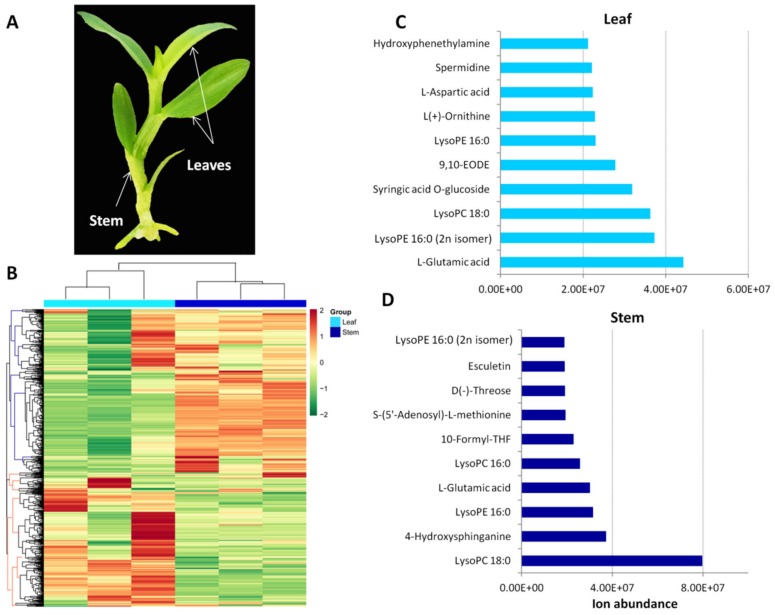
Figure 1.
Metabolic profiling in leaf and stem samples of Dendrobium officinale. (A) A picture of D. officinale plant highlighting the two organs used for metabolomic analysis. (B) A heatmap hierarchical clustering of the detected metabolites in leaves and stems. The Log2 of the metabolite quantification was used. The columns correspond to the organs while the rows represent the different metabolites. (C) Top 10 most abundant metabolites detected in leaf samples. (D) Top 10 most abundant metabolites detected in stem samples.

