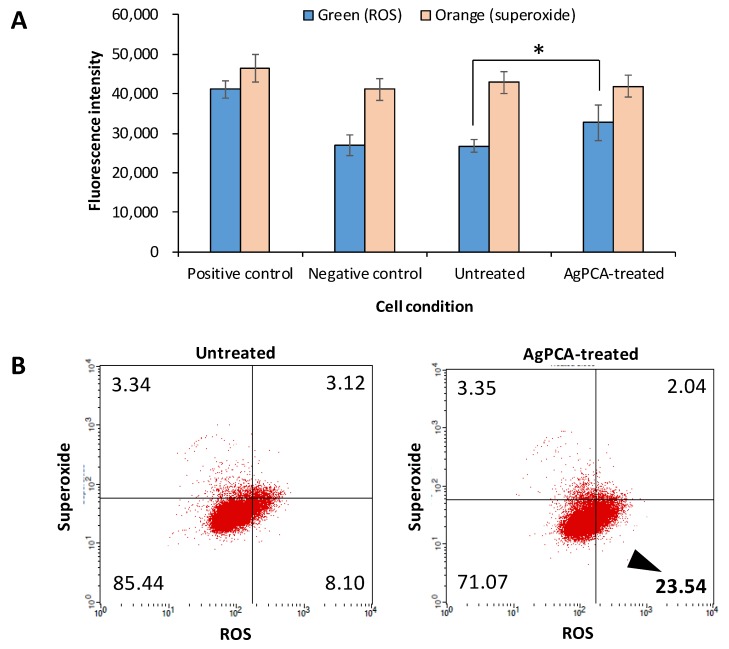
Figure 10.
Reaction oxygen species (ROS) and superoxide production of untreated control and AgPCA-treated HCT116 cells. (A) Fluorescence intensity of green (ROS) and orange (superoxide). Data are expressed as mean + standard deviation for triplicates within an individual experiment. Statistical significance was performed using Student’s t test. (* p < 0.05). (B) Dot-plots by flow cytometry. Untreated cells were used as control. Cell debris were ungated. The numbers reflect the percentage of the cells in each quadrant and are represented by average of three independent experiments. Black triangle shows the increased level of ROS in AgPCA-treated cells.

