Figure 2.
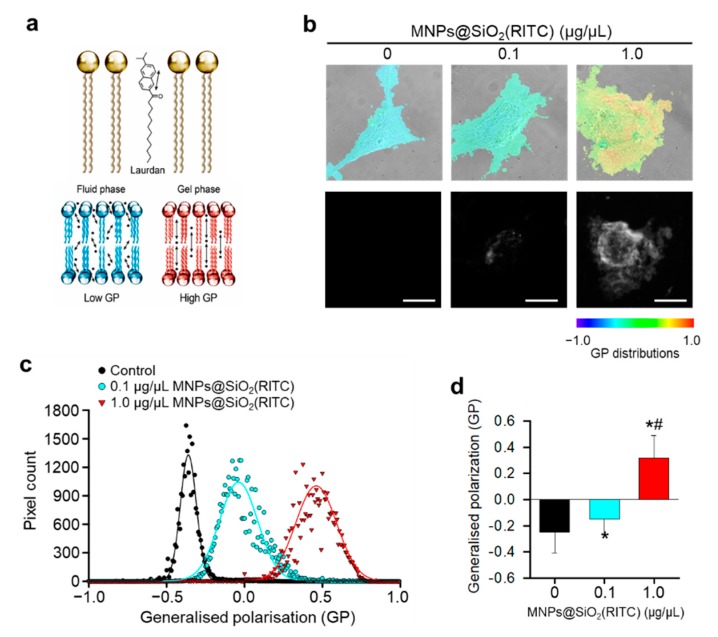
Laurdan generalized polarizations (GP) images and GP frequency distributions of hBM-MSCs treated with MNPs@SiO2(RITC) for 12 h. (a) Schematic of Laurdan for measuring membrane GP value. (b) Merged differential interference contrast (DIC) and total internal reflection fluorescence microscopy (TIRFM) images of human bone marrow-derived mesenchymal stem cells (hBM-MSCs) in each upper panel. Distributions of magnetic nanoparticles incorporating rhodamine B isothiocyanate (MNPs@SiO2(RITC)) are indicated in each lower panel. GP distributions ranged from −1.0 to 1.0. Scale bar = 2.5 µm. (c) GP frequency distributions of cells. GP values of each pixel are represented as dots and were fitted to Gaussian distributions. (d) Total GP values. Data represent mean ± SD of three independent experiments (n = 10). * p < 0.05 vs. non-treated control, # p < 0.05 for the comparison between cells treated with 0.1 and 1.0 µg/µL of MNPs@SiO2(RITC).

