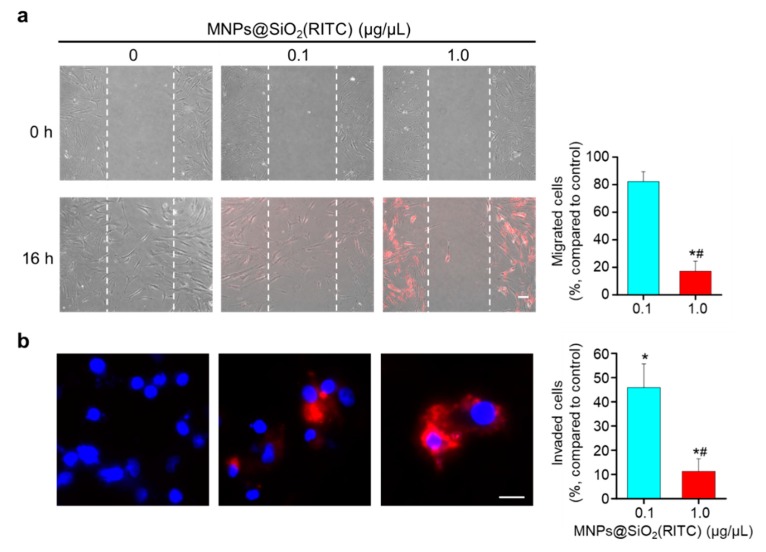
Figure 6.
Migratory activity of hBM-MSCs treated with MNPs@SiO2(RITC). (a) Representative images of wound healing assay and quantitative image analysis. Images of the initial wounded (0 h) layer are shown the upper panels. Images of cells after MNPs@SiO2(RITC) treatment for 16 h are shown in the lower panels. Scale bar = 100 μm. Quantitative image analysis of migrated cells in MNPs@SiO2(RITC)-treated hBM-MSCs are shown in the bar graph. (b) Representative images of hBM-MSCs and quantitative image analysis of the invasion assay results after MNPs@SiO2(RITC) treatment for 12 h. Red, MNPs@SiO2(RITC); blue, Hoechst 33342. Scale bar = 20 μm. Quantitative image analysis of invaded cells in MNPs@SiO2(RITC)-treated hBM-MSCs are shown in the bar graph. Data represent mean ± SD of three independent experiments. Data represent mean ± SD of three independent experiments. * p < 0.05 vs. non-treated control, # p < 0.05 for the comparison between cells treated with 0.1 and 1.0 µg/µL of MNPs@SiO2(RITC).

