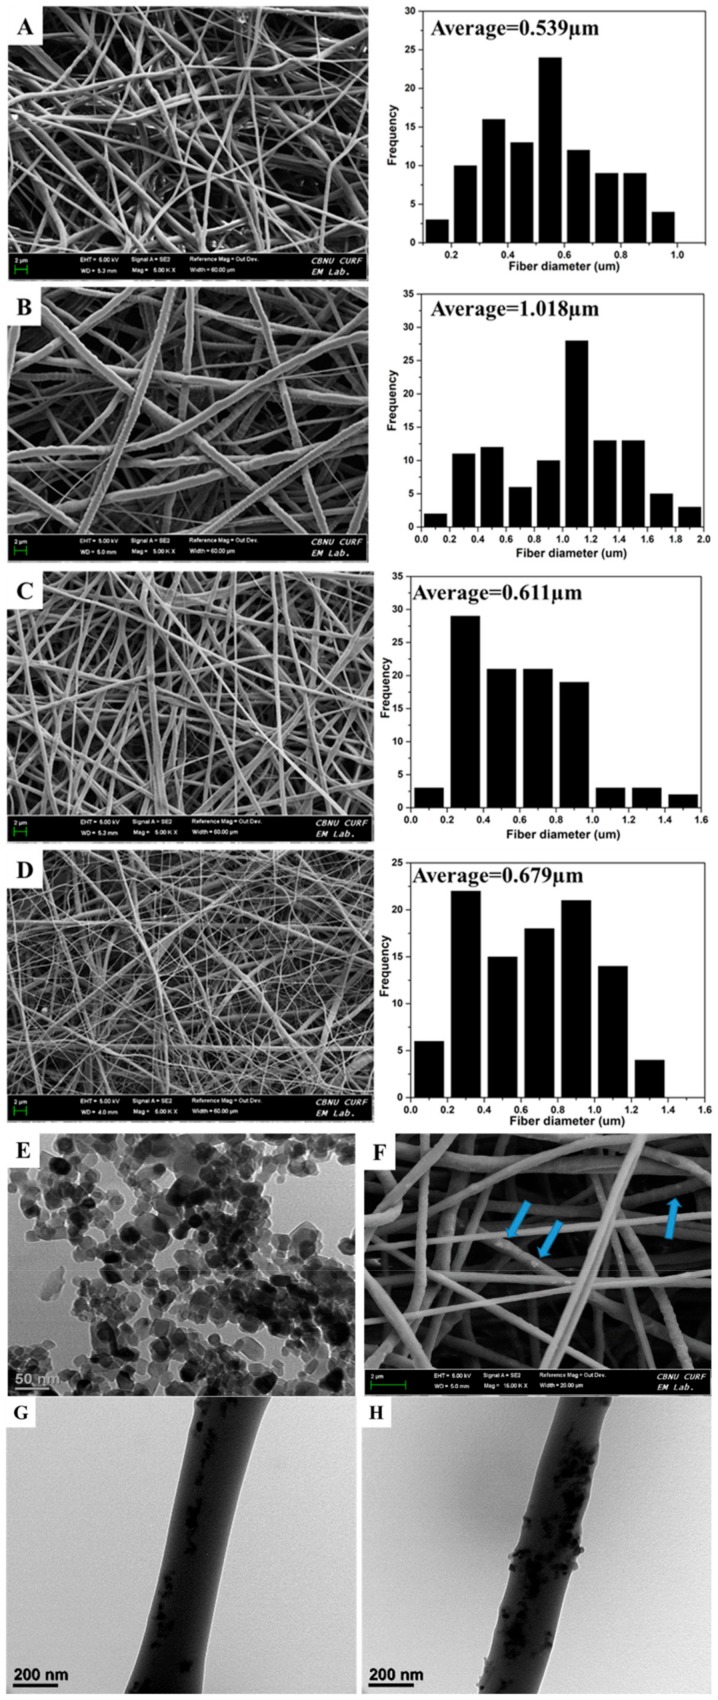
Figure 1.
FESEM images and fiber diameter distribution of (A) PCL, (B) PDO, (C) PP3T5T, and (D) PP5T5T. (E) BioTEM image of TiO2 NPs and (F) FESEM image showing loaded particles in PP5T5T mat. (G) and (H) BioTEM images of PP3T5T and PP5T5T respectively. Dual layer samples were named PP3T5T (PCL–PDO–3%TiO2–5%TTC) and PP5T5T (PCL–PDO–5%TiO2–5%TTC).

