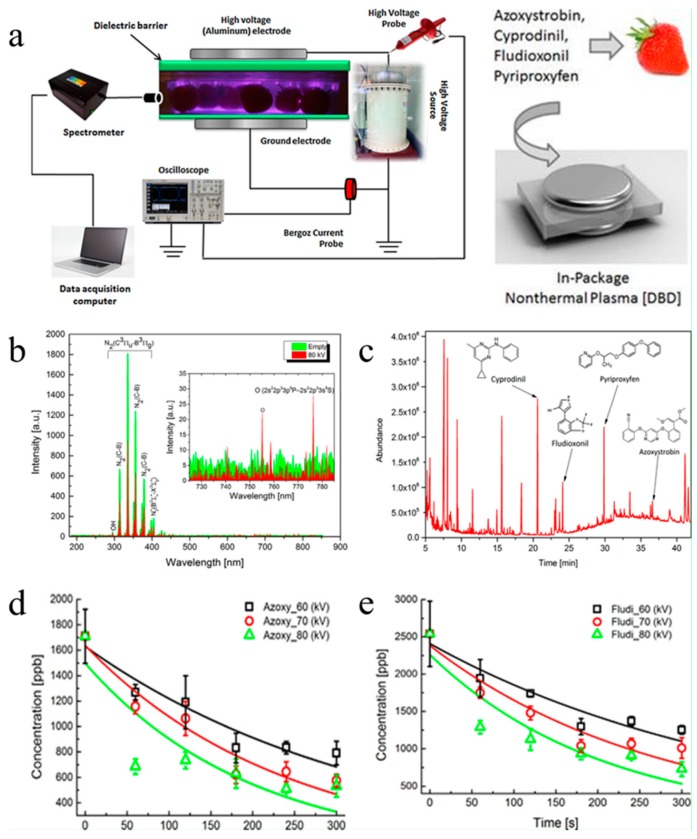
Figure 15.
(a) the diagram of the DBD experimental device; (b) emission spectrum with or without strawberries; (c) retention times chromatogram of the four pesticides; (d) azoxystrobin concentrations before and after plasma treatment; (e) fludioxonil concentrations after plasma treatment. Reproduced with permission from [162]; Copyright Elsevier, 2014.

