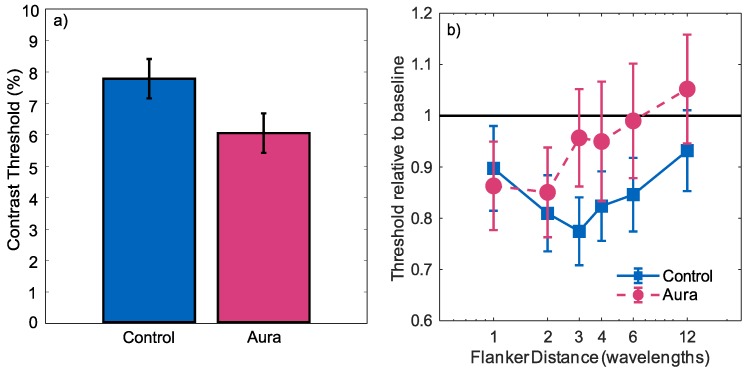
Figure 3.
(a) Contrast detection thresholds (75% correct) for aura and control groups for Gabor targets in the absence of flankers; (b) contrast detection thresholds (75% correct) for stimuli with flankers present. Thresholds are plotted relative to the condition’s baseline (marked by the horizontal black line). Normalisation was undertaken independently for the control and migraine groups. Error bars indicate standard deviation.

