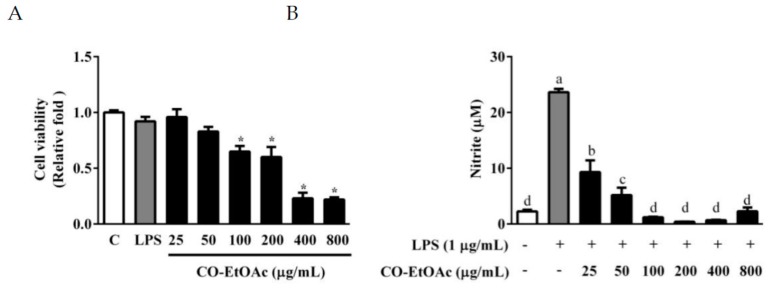
Figure 2.
The effects of different concentrations of CO-EtOAc on cell viability (A) and nitric oxide (NO) production (B) in RAW264.7 cells. RAW264.7 cells were treated with various concentrations of CO-EtOAc (25, 50, 100, 200, 400, and 800 μg/mL) in the presence or absence of lipopolysaccharide (LPS) (1 μg/mL) for 24 h. (A) Cell viability was measured using the WST-1 assay, and the (B) NO production in the cell culture supernatants determined using the Griess assay. The results are expressed as means ± standard deviation (SD) from three independent experiments. For cell viability, * indicates p < 0.05 when compared to the dimethyl sulfoxide (DMSO) control group. For NO production: values with different letters indicate significant difference (p < 0.05).

