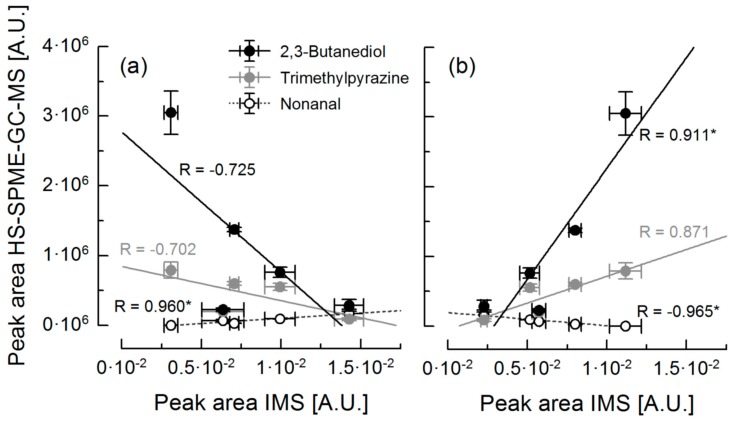
Figure 5.
Correlation analysis of peak areas of 2,3-butanediol, trimethylpyrazine and nonanal determined by HS-SPME-GC-MS (n = 2) and peak areas of peak 1 (a) and peak 7 (b) of IM spectra (n = 3) of bulk cocoa samples. * marked correlation coefficients are significant (p < 0.05). [A.U.]: arbitrary unit. IMS: ion mobility spectrometry

