Figure 1.
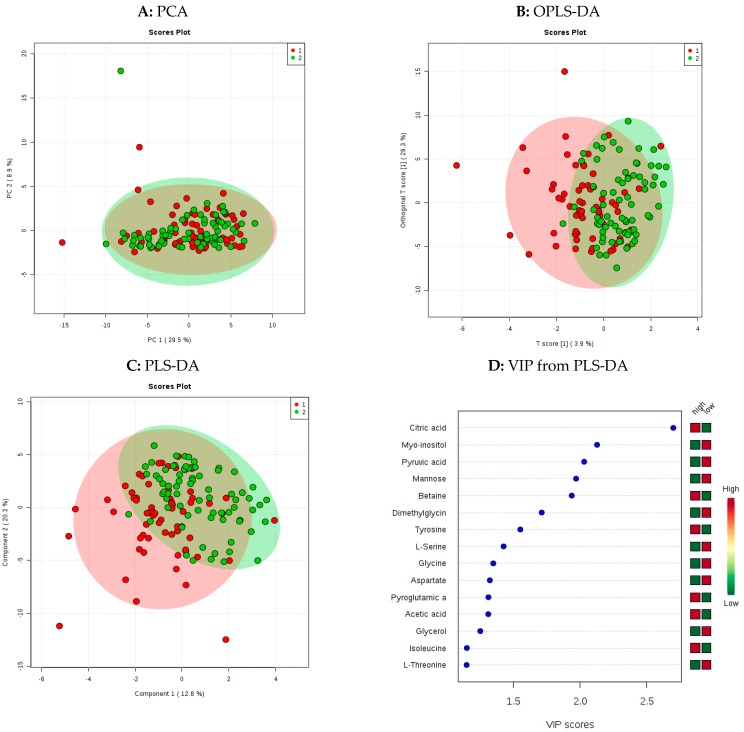
Multivariate statistical modelling of 1H-Nuclear Magnetic Resonance 1H-NMR metabolomic data. Plots A–C show group separation achieved by principal component analysis (PCA), orthogonal partial least squares discriminant analysis (OPLS-DA) and partial least squares discriminant analysis (PLS-DA). Red circles (●1) represent patients with high MDS and green circles (●2) represent individuals with low MDS. D: Is the resulting variable importance in project (VIP) plot indicating the 15 most influential metabolites responsible for the observed separation in the PLS-DA model.

