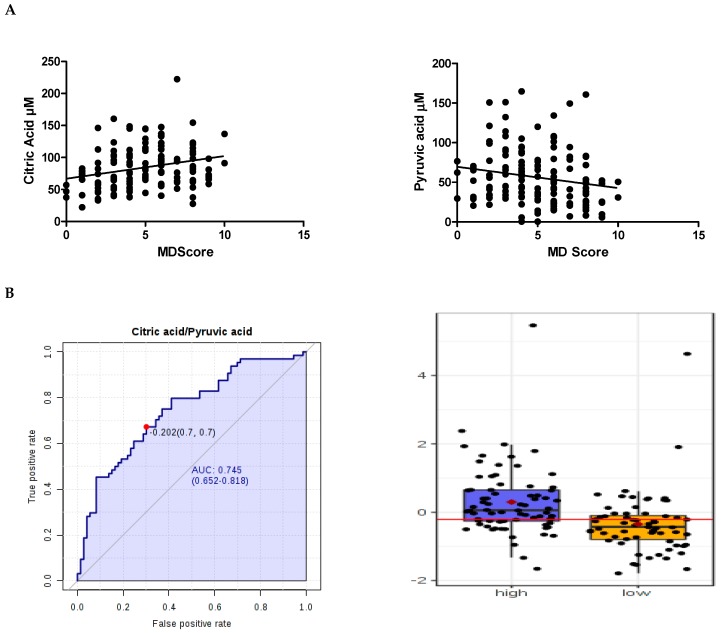
Figure 2.
Blood levels of citric acid and pyruvic acid and MDS. (A) Citric acid levels positively correlated with MDS, whereas Pyruvic acid levels negatively correlated. (B) A paired metabolite ratio of citric acid and pyruvic acid achieved the greatest area under the receiver operating characteristic (ROC) curve (AUC = 0.74) value which was the best performing biomarker for MDS. Optimal cutoff was represented on the curve with a red dot and with a red horizontal line on the box plot. The box-plot showed that the overall distribution profiles for low MDS (0–4) and high MDS (5–10) were broadly similar but the mean value was 53% higher in the high MDS group. Y-axis represents concentrations (µM). Data were median centred. The mean concentration of each group was indicated with a red diamond.

