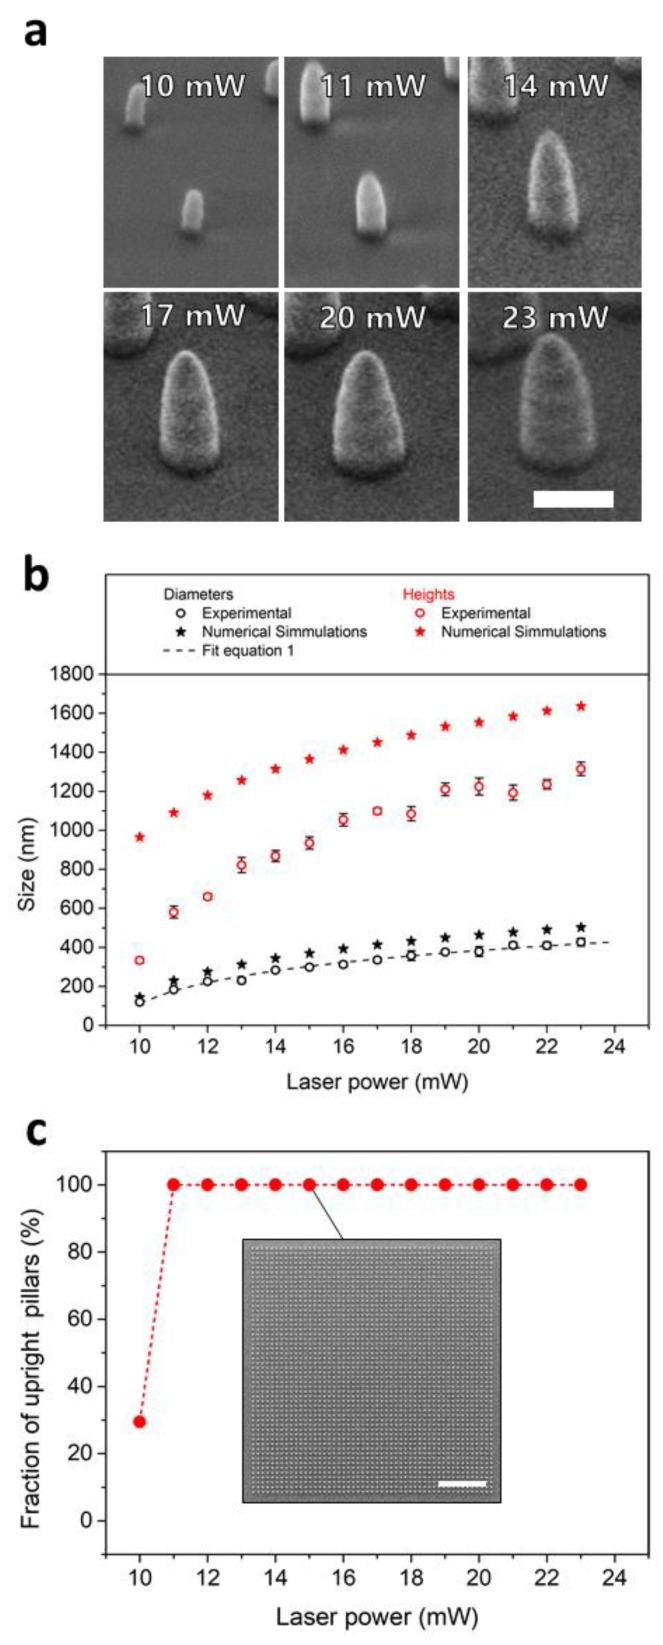
Figure 1.
Sizes of nanopillars as a function of the applied laser power. (a) Scanning electron micrographs of nanopillars fabricated with different laser powers. The scale bar is 500 nm. (b) Diameters (black symbols) and heights (red symbols) of the nanopillars obtained from two-photon lithography (open circles) compared to numerical simulations (filled stars). The dashed line shows the fit of the pillar diameters using Equation (1) to estimate the threshold laser power of the photo resist. (c) Defect rates of optical gratings expressed as fractions of upright pillars in dependence on the applied laser power. The values were obtained from Scanning Electron Microscopy (SEM)-images as shown for 15 mW in the insert. The scale bar is 10 µm.

