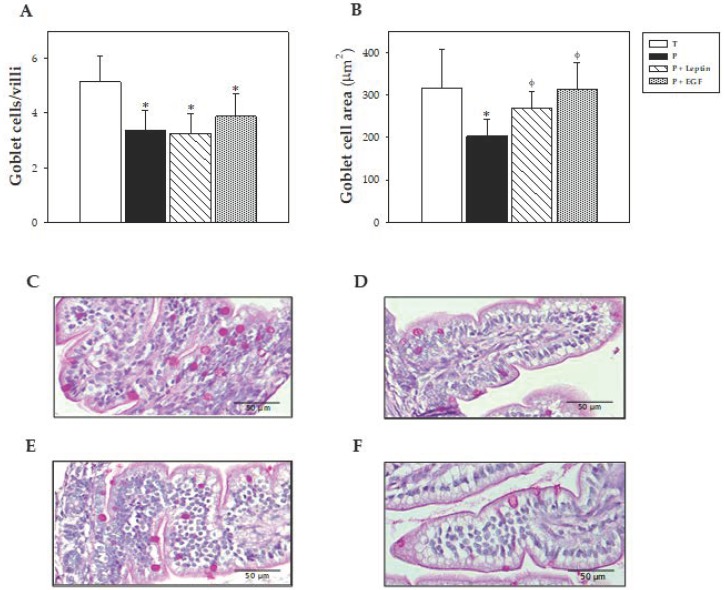
Figure 8.
Number of goblet cells/villi (A), goblet cells area (B), and representative images of histological sections of the jejunum with periodic acid−Schiff (PAS) staining from the four groups: Term (C), Preterm (D), P+Leptin (E), and P+epidermal growth factor (P+EGF) (F) at day 10 of the suckling period. Results of Figure 8A,B are expressed as mean ± SD (n = 6 pups/group). Statistical differences: * p < 0.05 versus T group; φ p < 0.05 versus P group. Goblet cells with densely stained granules can be observed along the length of the villi (Figure 8C–F). Scale bar = 50 μm for 400 ×.

