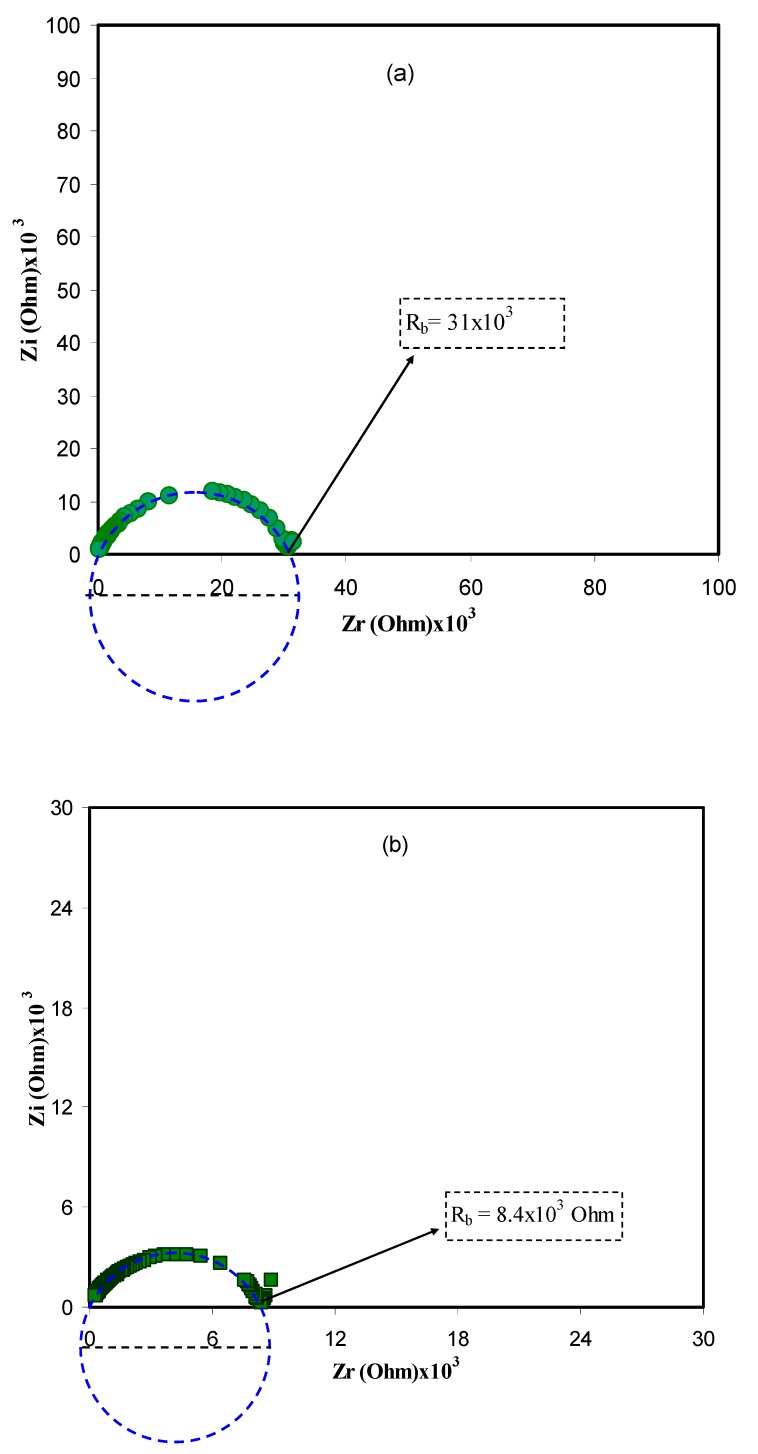
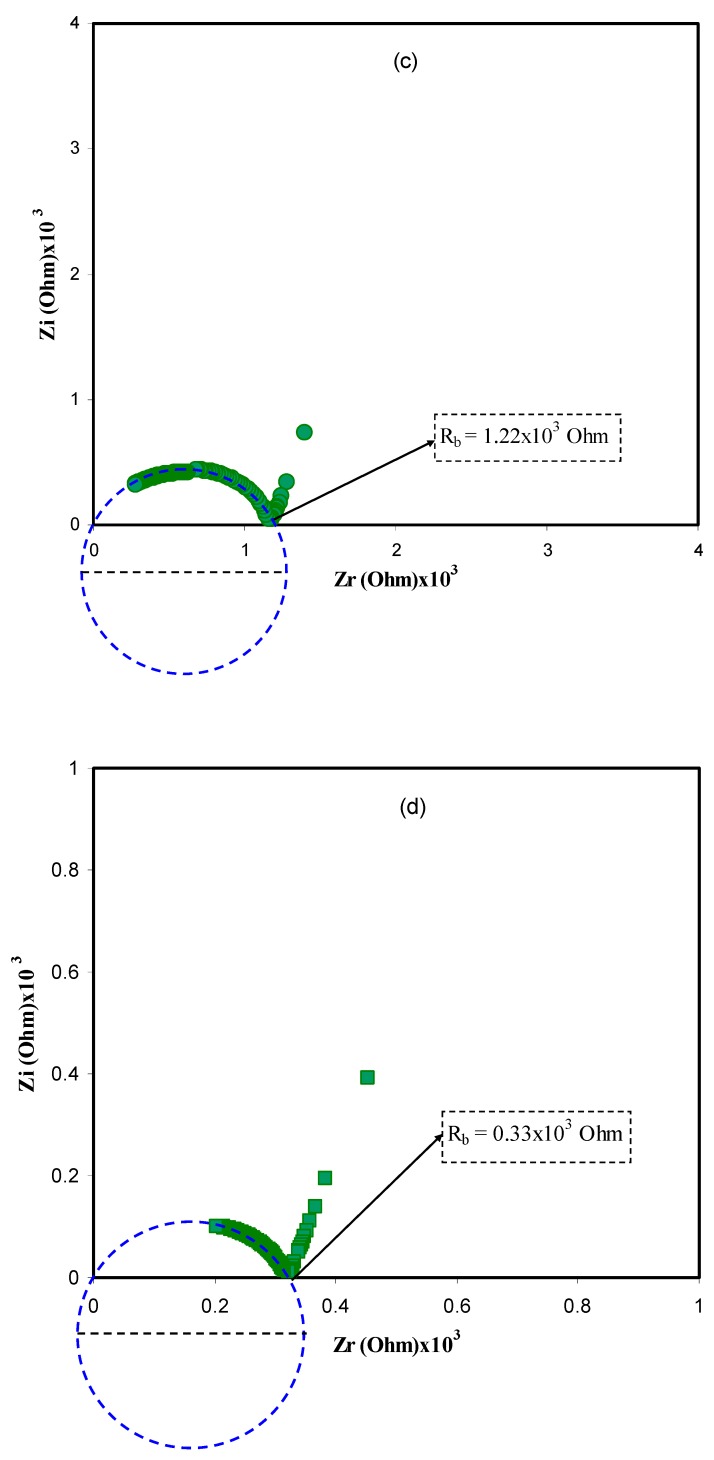
Figure 1.
Complex impedance plot of PVA:LiFC3SO3 (ZivsZr) solid electrolyte at (a) 303 K, (b) 323 K (c) 343 K, and (d) 353 K. The insets indicate the corresponding bulk resistance Rb. Clearly from 303 K to 353 K the diameter of the semicircles in impedance plots decreases and the spike regions were increased.


