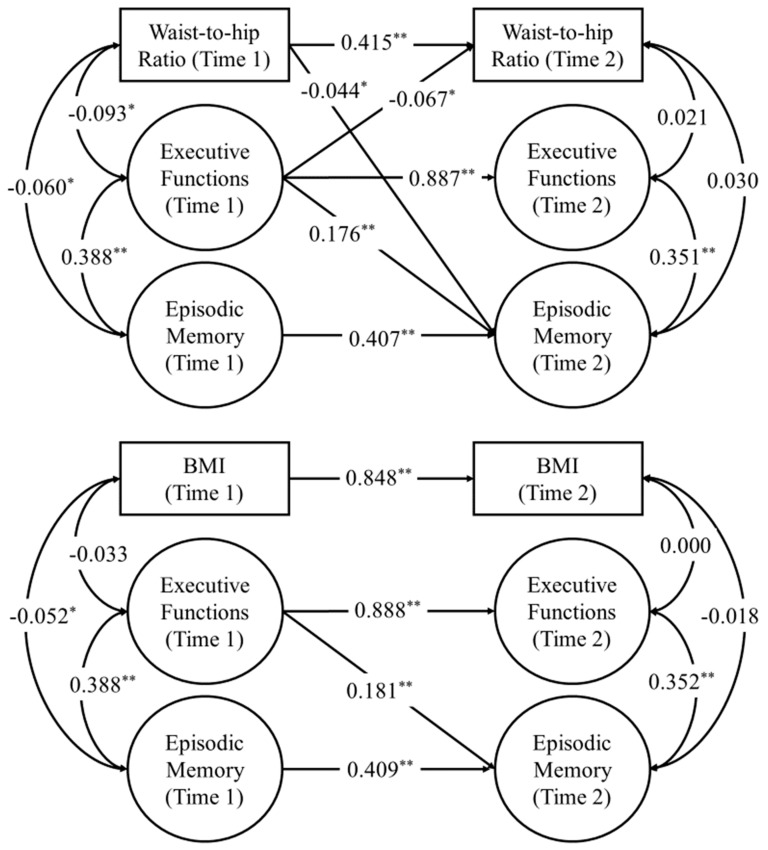
Figure 1.
Cross−lagged panel models after controlling for age, sex, education attainment, and household income. For the purposes of clarity, factor indicators, autocorrelations among indicator residuals, and control variables are not shown, and only significant cross−lagged paths are displayed. The analyses were conducted while holding the optimal equality constraints (partial scalar invariance). The numbers are standardized coefficient estimates. * p < 0.05 ** p < 0.001.

