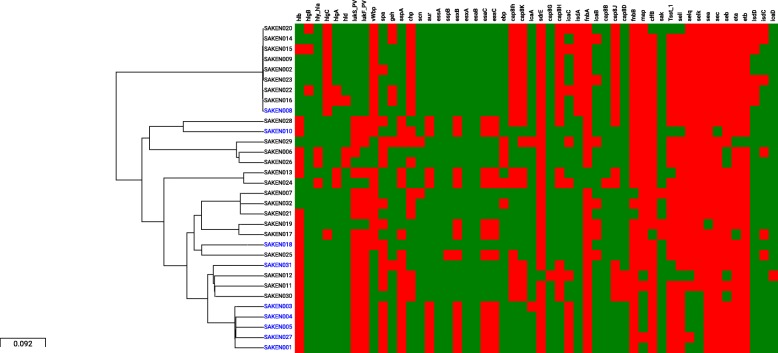
Fig. 4.
Core genome phylogeny and a heat map showing the distribution of virulence genes among study isolates. Green denotes the presence and red indicates the absence of the gene. Virulence factors are grouped according to function. Genes that were ubiquitously expressed among the isolates are not shown. MRSA isolates are shown in blue and MSSA isolates are in black

