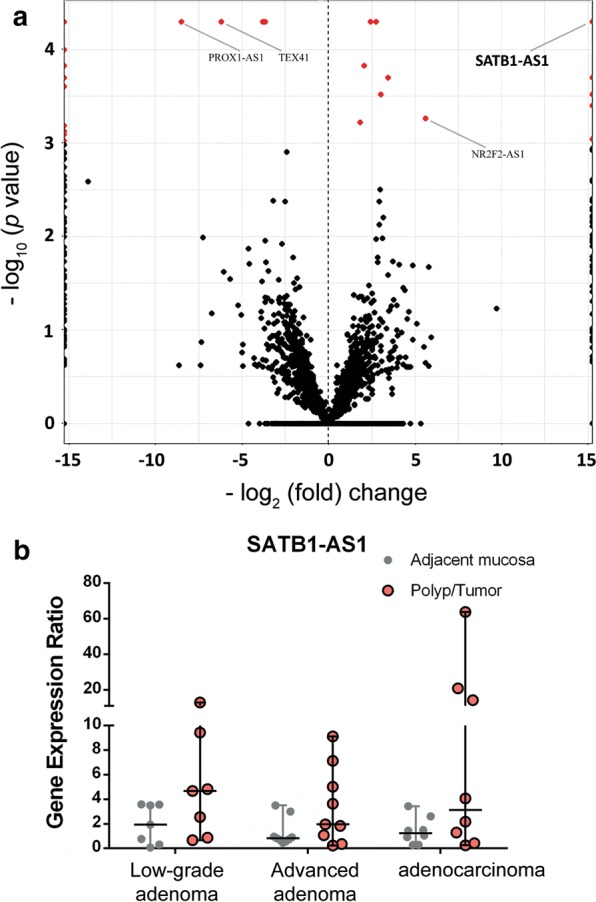
Fig. 4.

Volcano plot of differentially expressed genes in CRC and expression profiling of SATB1-AS1 in patient samples. a Volcano plot of differentially expressed genes (p < 0.001) in tumoral versus adjacent mucosal colorectal adenocarcinoma samples. The horizontal axis shows the log2 fold up-regulation (to the right) and down-regulation (to the left) in the expression of genes. The vertical axis demonstrates negative log10 of the p-value of Fisher’s exact test. Each gene is represented by one circle on the graph. Red circles represent genes that are significantly de-regulated. b Quantified expression of SATB1-As1 in the polyp/tumoral tissue in comparison with normal tissue in patients with low-grade adenoma, advanced adenoma, and adenocarcinoma
