Fig. 4.
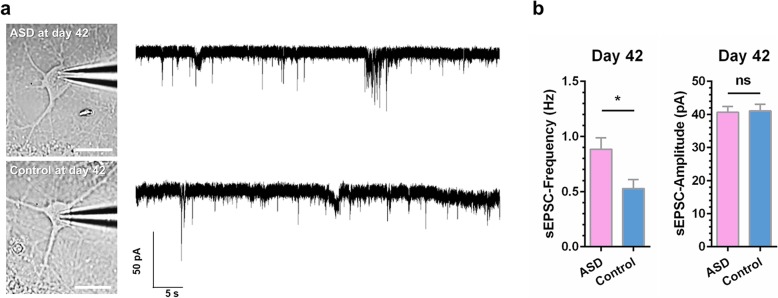
Increased frequency of sEPSCs in UiPSC-derived neurons of the autistic savant on day 42. a Sample images of UiPSC-derived neurons with astrocyte co-culture and sample whole-cell voltage-clamp recording traces of sEPSCs. Scale bar, 20 μm, 50 pA and 5 s. b Increased frequency, but not amplitude, of sEPSCs in UiPSC-derived neurons of the autistic savant. Quantification of sEPSCs. Values are presented as the mean ± SEM. N ≥ 4 cultures; n = 26–33 neurons for each line; unpaired Student’s t test

