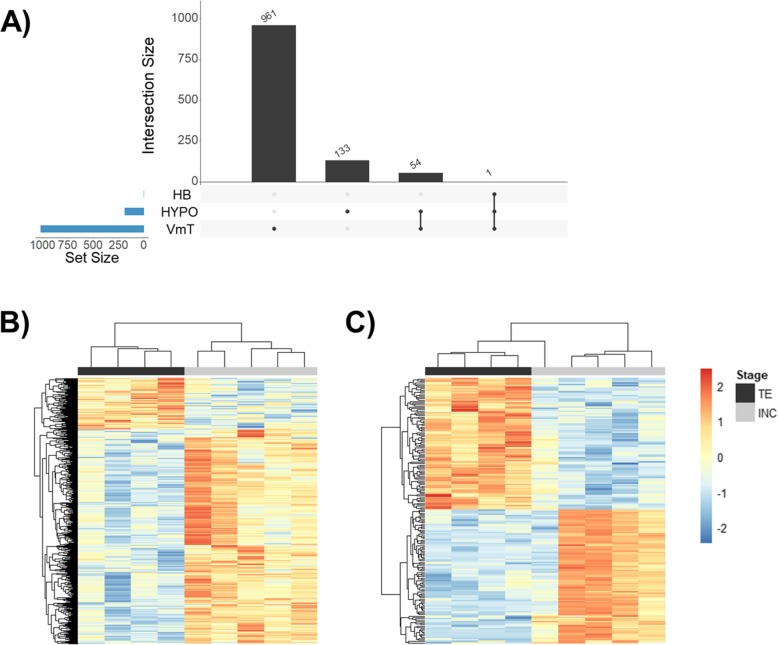
Fig. 1.
a UpSet plot depicting the number of unique and shared differentially expressed genes in the ventromedial telencephalon (VmT), hypothalamus (HYPO), and hindbrain (HB) from females collected during territory establishment (TE) and incubation (INC) breeding stages. Intersection size is the number of differentially expressed genes and the black dots on the x-axis represent whether these genes are present or absent in that set (i.e., VmT, HYPO, and/or HB). Heatmaps depicting differentially expressed genes between TE (dark gray) and INC (light gray) in (b) VmT and (c) HYPO. Each column is an individual and each row is a gene. Heatmaps are scaled across rows to allow for comparisons of gene expression across individuals. Color indicates log(FPKM+ 1); blue (lower) and red (higher) expression. Rows and columns are clustered using Euclidean distance

